

BosWash vs Jing-Jin-Ji: How Megaregion Population Density Shapes the Future of the U.S. and China
- POLITICIANS CLUB
- Dec 21, 2025
- 23 min read
1. Executive Summary
Megaregions have become central spatial units through which national power, governance capacity, and long-term development trajectories are organized. This article compares two of the most consequential megaregions in the contemporary international system—BosWash in the United States and Jing-Jin-Ji in China—through a focused examination of population density patterns derived exclusively from open data and introductory-level geospatial analysis.
The analysis demonstrates that contrasting population density structures reflect fundamentally different governance logics. In the United States, BosWash exhibits a continuous, corridor-style density pattern extending from Boston to Washington, D.C., characterized by multiple dense cores linked through spatial continuity. This configuration aligns with a market-driven agglomeration logic, in which firms, institutions, and populations cluster through decentralized decision-making without a centralized megaregional authority. In contrast, Jing-Jin-Ji displays a pronounced core–periphery density structure, with extreme concentration in Beijing and Tianjin and sharp density gradients across administrative boundaries. This pattern is consistent with state-directed spatial engineering, reflecting centralized planning objectives and hierarchical governance.
The article’s contribution is twofold. First, it demonstrates how open population data and transparent geospatial workflows—implemented in Python using publicly available administrative boundaries—can generate policy-readable spatial evidence without reliance on proprietary GIS tools or advanced modeling. Second, it establishes population density maps as a visual analytical anchor, allowing structural comparison before introducing academic literature or strategic interpretation.
Megaregions matter for national strategy because they concentrate population, infrastructure, and institutional capacity into spatial formations that condition innovation, logistics, governance reach, and resilience. A key visual insight from the density maps is that BosWash achieves spatial continuity without centralized megaregional governance, whereas Jing-Jin-Ji exhibits centralized authority without full spatial continuity. This contrast highlights that governance strength and spatial integration do not scale linearly.
From a G2 perspective, the core strategic insight is that spatial structure itself functions as a constraint and enabler of governance capacity. Corridor-based continuity and core-periphery concentration represent distinct megaregional architectures, each embedding different risks, advantages, and limits for long-term competition between the United States and China.
2. Conceptual Foundations
2.1 What Is a Megaregion?
A megaregion is a large, multi-city urbanized system characterized by dense and sustained interconnections across economic activity, infrastructure, population, and institutions that extend beyond the boundaries of individual metropolitan areas. Unlike standalone cities or conventional metropolitan regions, megaregions function as integrated spatial systems, within which labor markets, transport corridors, innovation ecosystems, and governance arrangements operate across multiple jurisdictions.
The defining feature of a megaregion is not administrative unity, but functional integration at scale. Spatial continuity, intensity of interaction, and cross-boundary linkage distinguish megaregions from loosely connected urban clusters. As such, megaregions are best understood as spatial formations that emerge—or are constructed—through the interaction of demographic concentration, infrastructure networks, and governance structures.
BosWash is widely regarded as the historical archetype of the megaregion concept. Stretching from Boston to Washington, D.C., it developed incrementally through market-driven agglomeration reinforced by transport infrastructure, institutional density, and long-term economic integration. Its emergence was not the result of a single policy initiative or formal megaregional authority, but of cumulative spatial processes operating over decades.
Jing-Jin-Ji, by contrast, represents a state-led megaregional integration project. It is explicitly defined through policy, administrative coordination, and strategic planning aimed at linking Beijing, Tianjin, and Hebei into a unified spatial system. Rather than emerging organically from decentralized economic decisions, Jing-Jin-Ji reflects deliberate efforts to restructure spatial relationships in support of national development objectives.
2.2 Why BosWash vs. Jing-Jin-Ji?
The comparison between BosWash and Jing-Jin-Ji is analytically valuable because it contrasts two fundamentally different megaregional formation logics under otherwise comparable conditions of scale and national importance.
In the United States, megaregional structure emerges primarily through market-driven spatial agglomeration. Firms, households, and institutions cluster where economic returns, accessibility, and network effects are strongest. The resulting spatial form is a corridor-like configuration characterized by multiple dense cores connected through continuity rather than hierarchy. Governance at the megaregional scale remains fragmented, with coordination occurring indirectly through infrastructure, markets, and inter-jurisdictional interaction rather than centralized planning.
In China, megaregional structure is shaped through policy-driven spatial engineering. Jing-Jin-Ji is designed to relieve congestion in Beijing, redistribute functions across jurisdictions, and strengthen state capacity through coordinated planning and administrative realignment. Spatial form is therefore closely linked to political centrality and hierarchical governance, producing a core–periphery configuration that reflects deliberate policy choices rather than emergent market patterns.
Both megaregions function as national “power engines”, concentrating population, infrastructure, and institutional capacity into spatial formations that exert disproportionate influence on economic performance, governance reach, and strategic positioning. Their contrast makes them especially suitable for comparative analysis in a G2 context, not as competing models to be ranked, but as structurally distinct spatial architectures through which governance logic is expressed.
3. Data Sources
This study relies exclusively on open, publicly accessible datasets to ensure transparency, reproducibility, and policy relevance. No proprietary GIS software, restricted databases, or paid datasets are used at any stage of data acquisition, processing, or visualization.
3.1 BosWash (United States)
Population data for BosWash are drawn from official county-level datasets published by the U.S. Census Bureau. County-level population counts are used to provide a consistent spatial resolution across the entire United States and to avoid selective aggregation or metropolitan boundary bias.
Administrative boundaries are sourced from TIGER/Line shapefiles, which provide standardized, nationwide geospatial definitions of counties and other administrative units. County-level units are selected to maximize transparency, ensure full coverage of the BosWash corridor, and maintain methodological consistency with national-scale population data.
In addition, selected city-level open datasets (including Boston, New York City, Philadelphia, Baltimore, and Washington, D.C.) are referenced for contextual grounding and geographic orientation. These city-level datasets are not used as analytical units for density calculation, but serve to situate the megaregion spatially within its major urban cores.
3.2 Jing-Jin-Ji (China)
Population data for Jing-Jin-Ji are based on the 2020 National Census released by the National Bureau of Statistics of China, using county-equivalent administrative units. This resolution aligns with the introductory-level analytical scope of the study while allowing meaningful intra-regional comparison.
Administrative boundaries are obtained from GeoBoundaries, using non-simplified GeoJSON files at the ADM1 and ADM2 levels for China. ADM2 units within Beijing, Tianjin, and Hebei Province are extracted to define the spatial extent of the Jing-Jin-Ji megaregion. The use of non-simplified boundaries preserves geometric fidelity for area calculation and visualization.
Open Data Commitment
Across both cases, data selection adheres to three principles:
Public accessibility – all datasets can be accessed without licensing restrictions.
Administrative clarity – official boundary definitions are used to avoid ambiguous spatial units.
Reproducibility – all data sources can be independently retrieved and verified by third parties.
This open-data-only approach ensures that the resulting population density maps function as auditable spatial evidence, suitable for policy analysis, legislative discussion, and comparative research.
4. Geospatial Analysis Methodology
The geospatial analysis in this study is designed to be transparent, reproducible, and accessible to non-specialist audiences, including policymakers and legislative staff. The objective is not methodological sophistication, but the production of policy-readable spatial evidence that enables structural comparison between megaregions under a clearly defined analytical scope.
4.1 Tools
All data processing and visualization are conducted using Python in Google Colab, a browser-based computational environment that requires no local software installation. This choice supports reproducibility and lowers the barrier for independent verification.
The core Python libraries used are:
pandas for tabular data handling and preprocessing
GeoPandas for spatial data operations, including geometry handling, projection, and area calculation
Folium for interactive, web-compatible map visualization
All final visual outputs are rendered using the geographic coordinate reference system EPSG:4326 (WGS 84). This CRS is selected specifically for web display compatibility, interoperability with Folium/Leaflet, and ease of reproduction across platforms.
4.2 Analytical Steps
The analytical workflow follows a fixed, linear sequence applied identically to both BosWash and Jing-Jin-Ji. This structure is locked in advance to prevent post-hoc adjustment or selective interpretation.
Load administrative boundary dataOfficial administrative boundary datasets (county-level for the United States; ADM2-level for China) are imported as GeoDataFrames.
Load population dataCensus-based population tables are loaded and cleaned to align with the corresponding administrative units.
Merge datasetsPopulation data are merged with boundary geometries using standardized administrative identifiers or name-based matching, depending on data availability.
Compute land area (km²)All geometries are temporarily reprojected to a meter-based projected CRS to calculate land area accurately, then converted to square kilometers.
Calculate population densityPopulation density is computed uniformly as population divided by land area (people per km²). No alternative indicators are introduced at this stage.
Generate choropleth heatmapsPopulation density values are visualized using standardized choropleth maps for each megaregion. Classification schemes, color logic, and legends are fixed in advance to avoid visual bias and ensure comparability.
Methodological Scope and Constraints
This methodology is explicitly introductory in nature. It prioritizes clarity, auditability, and comparability over advanced spatial modeling or causal inference. No spatial econometrics, predictive modeling, or optimization techniques are applied.
By constraining the analysis to a small number of transparent steps and a single analytical variable, the methodology ensures that observed differences between BosWash and Jing-Jin-Ji can be attributed to spatial structure, rather than to hidden technical complexity or model-driven assumptions.
This disciplined approach establishes a clear evidentiary foundation for subsequent descriptive interpretation and literature-based synthesis.
5. Results: Population Density Patterns
This section presents first-order, descriptive results derived directly from the population density choropleth maps. Interpretation is limited to what the maps show. Explanatory arguments and literature-based discussion are reserved for subsequent sections.
5.1 BosWash Population Density Pattern
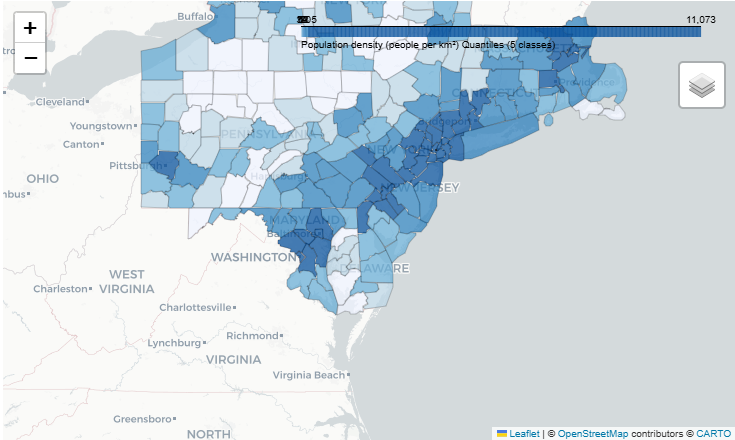
[Figure 1. Population density heatmap of the BosWash megaregion.]
The BosWash population density map shows a continuous, corridor-oriented spatial structure extending from Boston to Washington, D.C., passing through intermediate metropolitan cores including New York City, Philadelphia, and Baltimore.
At the county level, population density is distributed across multiple high- and medium-density units that form an almost uninterrupted linear spine along the Northeast Corridor. Rather than converging on a single dominant center, density is shared among several urban cores, each embedded within a broader field of moderately dense counties.
Transitions between density classes are generally gradual, with few abrupt discontinuities. High-density counties frequently extend across state and county boundaries, indicating that administrative borders do not strongly segment the spatial distribution of population within the megaregion.
Taken together, the BosWash pattern can be described as a polycentric corridor with strong spatial continuity, in which population density is organized through connected urban nodes rather than hierarchical concentration. This description is derived solely from the visual and numerical properties of the population density map and does not imply causal mechanisms or evaluative judgment.
5.2 Jing-Jin-Ji Population Density Pattern

[Figure 2. Population density heatmap of the Jing-Jin-Ji megaregion.]
The Jing-Jin-Ji population density map exhibits a pronounced core–periphery spatial structure centered on Beijing and Tianjin. At the ADM2 (county-equivalent) level, the highest density values are tightly concentrated within these core municipalities, producing visually dominant centers.
Moving outward from the cores, population density declines sharply, forming clear and abrupt gradients rather than gradual transitions. These density breaks frequently align with administrative boundaries, particularly between the core municipalities and surrounding units within Hebei, resulting in a segmented spatial pattern.
Outside the core areas, large portions of the megaregion display comparatively low to moderate density, reinforcing the visual separation between central and peripheral zones. Within this broader configuration, planned focal areas—most notably Xiong’an New Area—appear as localized points of emphasis rather than as elements of a continuous high-density field.
Overall, the Jing-Jin-Ji map is characterized by strong central concentration, sharp internal discontinuities, and limited corridor-style continuity. This description is derived solely from observed density distributions and boundary alignments in the map and does not assert causal explanation or evaluative assessment.
5.3 Direct Structural Contrast Between BosWash and Jing-Jin-Ji
A direct, side-by-side reading of the population density maps highlights a clear structural contrast between the two megaregions that is visible without reference to theory, governance explanation, or academic literature.
BosWash is characterized by spatial continuity. Population density is distributed along a linear corridor, with multiple urban cores connected through an almost uninterrupted chain of medium- and high-density counties. Density transitions are generally gradual, and administrative boundaries do not produce sharp visual breaks in the spatial pattern. The dominant feature is therefore connectivity across space, rather than hierarchical concentration.
Jing-Jin-Ji, by contrast, is characterized by spatial concentration and segmentation. Population density is tightly clustered in a small number of core municipalities, with rapid declines in surrounding areas. Density gradients are steep, and spatial discontinuities frequently coincide with administrative boundaries. High-density areas function as isolated centers, rather than as components of a continuous corridor.
The contrast can be summarized as follows:
BosWash: corridor-oriented, polycentric, and spatially continuous
Jing-Jin-Ji: core–periphery oriented, centralized, and spatially discontinuous
These differences represent descriptive outcomes of the population density data. At this stage of the analysis, they establish a shared empirical baseline for subsequent sections on governance logic, academic evidence, and strategic implications, without implying causality, performance evaluation, or normative judgment.
6. Why Do These Patterns Emerge?
Governance and Policy Logic Behind Megaregions
The population density patterns observed in BosWash and Jing-Jin-Ji can be interpreted as the spatial expression of distinct governance and policy logics. This section explains why the two megaregions display contrasting structures, drawing only on the observed maps and their spatial properties. No academic citations or external validation are introduced at this stage.
BosWash: Market-Driven Agglomeration and Corridor Continuity
In BosWash, the corridor-style density pattern reflects a governance environment in which spatial outcomes emerge primarily through decentralized market processes. Firms, households, and institutions locate based on accessibility, network effects, and cumulative advantage, rather than through centralized spatial directives.
Over time, these decisions reinforce each other along existing transport and economic axes, producing spatial continuity across multiple urban cores. The absence of a single dominant center allows density to be distributed across a chain of metropolitan areas, while administrative boundaries exert limited influence on the overall density pattern. The result is a polycentric corridor in which population concentration follows connectivity rather than hierarchy.
Jing-Jin-Ji: State-Led Spatial Engineering and Core–Periphery Structure
In Jing-Jin-Ji, the observed core–periphery pattern is consistent with a governance logic characterized by centralized authority and deliberate spatial intervention. Density concentration in core municipalities reflects political and administrative centrality, while surrounding areas are shaped through planned functional redistribution.
Rather than producing gradual spatial transitions, this approach generates sharp density gradients aligned with jurisdictional boundaries. Peripheral areas remain structurally distinct from the cores, and new development zones appear as targeted interventions within a broader centralized framework, rather than as extensions of continuous corridor growth.
Governance Logic as a Spatial Shaping Force
Taken together, the maps suggest that governance logic acts as a structuring constraint on how population density is organized at the megaregional scale. Market-driven systems tend to produce continuity and shared density across space, while state-directed systems tend to produce concentration and segmentation.
These observations do not imply superiority, efficiency, or policy success. They simply indicate that how authority is exercised—decentralized versus centralized—corresponds closely with how density is distributed across megaregions. This governance–space relationship provides the conceptual bridge to the literature-based analysis that follows, where these patterns are examined against existing empirical and theoretical work.
7. Evidence from Academic Literature
7.1 Identifying Relevant Theses with Consensus
Academic literature is introduced only after the population-density maps establish the observed spatial structures in BosWash and Jing-Jin-Ji. The purpose of this step is not to retroactively validate the maps, but to examine whether the observed corridor versus core–periphery contrast aligns with, contradicts, or complicates findings documented in existing research.
Two-Stage Intake Logic
Literature intake follows a fixed, auditable two-stage process designed to preserve transparency and prevent selective interpretation.
Stage 1: Consensus-based discoveryAn initial discovery pass identifies papers that are:
frequently cited or central within the relevant research space,
explicitly spatial in focus (addressing corridors, cores, polycentricity, boundary effects, or megaregional form),
empirically grounded and published in peer-reviewed journals.
This stage is used to surface recurring thesis families rather than to assemble an exhaustive bibliography.
Stage 2: Structured extraction (uniform protocol)All selected papers are then processed using a structured extraction protocol applied uniformly across the corpus. Each paper is interrogated using the same fixed questions, ensuring that differences in interpretation arise from the literature itself rather than from variable reading strategies.
Search Strategy and Keywords
Search queries are designed to target recurring conceptual clusters relevant to the spatial patterns observed in the maps, including:
megaregions and mega-conurbations,
corridor urbanization and infrastructure-led integration,
polycentricity and core–periphery structures,
administrative boundary effects and spatial discontinuities,
mobility networks and functional integration at the megaregional scale.
The search logic explicitly prioritizes literature capable of informing both corridor-style continuity and core-centered concentration, reflecting the structural contrast identified in the spatial analysis.
Selection Criteria
To maintain analytical discipline, inclusion is restricted to studies that meet the following criteria:
peer-reviewed journal articles,
explicit engagement with spatial form rather than purely economic or demographic outcomes,
sufficient methodological transparency to allow structured interrogation,
relevance to either BosWash-type corridor systems, Jing-Jin-Ji-type core–periphery systems, or cross-regional governance and measurement issues.
Grey literature, policy advocacy documents, and purely normative contributions are excluded.
Metadata Logging and Thesis Organization
Each selected paper is logged with standardized metadata, including publication year, geographic focus, and conceptual role. Papers are then organized into a predefined set of recurring claims, which serve as analytical anchors for later synthesis.
This organization ensures that subsequent interpretation is built on:
a finite and transparent evidence base,
clearly delineated propositions rather than ad hoc citation,
and consistent treatment across regions and themes.
At this stage, no synthesis or interpretation is performed. The section functions solely as a controlled intake layer, establishing the evidentiary foundation for the cross-regional synthesis that follows.
7.2 Mapping Conceptual Connections Between Theses
After relevant theses are identified and logged, the next step is to examine how these theses relate to one another conceptually. The objective of this section is not to rank studies or evaluate their conclusions, but to map the structure of ideas within the literature and to identify recurring clusters, overlaps, and boundaries.
Purpose of Conceptual Mapping
Conceptual mapping serves three functions.
Revealing structure within the literatureRather than treating papers as isolated contributions, this step identifies how multiple studies converge around shared spatial concepts such as corridors, core–periphery structures, polycentricity, boundary effects, and functional integration.
Avoiding selective synthesisBy mapping relationships explicitly, this process reduces the risk of emphasizing a narrow subset of studies while overlooking contradictory or adjacent strands of research.
Preparing for structured synthesisThe resulting map provides a transparent basis for subsequent synthesis, ensuring that interpretive claims can be traced back to identifiable conceptual clusters rather than to individual citations.
Method for Mapping Conceptual Relationships
Conceptual connections are identified by examining overlaps across the structured extraction fields recorded for each paper. Connections are defined by shared emphasis on:
Spatial form (e.g., corridor continuity, core–periphery concentration, polycentric fields)
Scale of analysis (intra-urban, inter-urban, megaregional)
Governance presence (explicit governance mechanisms, implicit coordination, or absence of governance discussion)
Empirical grounding (network-based data, administrative units, mobility flows, land-use change)
Papers that share multiple attributes are treated as conceptually proximate, while those that overlap on only one dimension are treated as more loosely connected.
Emergent Conceptual Clusters
Through this mapping process, several recurring clusters emerge:
Corridor-oriented integrationStudies emphasizing linear connectivity, infrastructure-led integration, and continuity across administrative boundaries.
Core–periphery concentrationResearch focused on dominant urban cores, steep density gradients, and hierarchical spatial organization.
Polycentric and hybrid structuresPapers documenting multi-core systems that nonetheless exhibit internal hierarchies or incomplete integration.
Administrative boundary and measurement effectsWork highlighting how jurisdictional boundaries and spatial units shape observed density patterns and analytical outcomes.
These clusters are not mutually exclusive. Some papers bridge multiple clusters, functioning as conceptual connectors rather than as cluster-specific contributions.
Cross-Regional Positioning
Conceptual mapping also reveals that many clusters are not region-specific. Corridor-related arguments appear across multiple geographic contexts, while core–periphery dynamics recur in both market-oriented and state-led systems. This cross-regional overlap supports treating BosWash and Jing-Jin-Ji not as exceptional cases, but as distinct configurations within a shared conceptual space.
Analytical Boundary of This Step
At this stage, the mapping remains strictly descriptive. No weighting, validation, or evaluative judgment is applied to clusters or connections. The output of this step is a conceptual landscape of the literature, which establishes the foundation for the structured synthesis presented in the next section.
7.3 Structured Synthesis
This section synthesizes the academic literature identified and mapped in Sections 7.1 and 7.2 using a structured, rule-based analytical protocol. The objective is not to introduce new interpretations or theoretical claims, but to organize existing findings into a coherent framework that can be systematically compared with the observed spatial patterns in BosWash and Jing-Jin-Ji.
Synthesis Procedure
The synthesis is conducted through a controlled and standardized process designed to ensure consistency and comparability across studies. Each selected paper is examined to:
identify recurring definitions and conceptual framings,
extract commonly discussed mechanisms related to spatial structure and governance, and
record points of convergence and divergence across the literature.
To prevent selective emphasis or interpretive drift, identical analytical rules are applied uniformly to all papers included in the corpus.
Evidence Control and Scope
All synthesis operates on a fixed and predefined evidence base established in Sections 7.1 and 7.2. No additional publications, datasets, or concepts are introduced at this stage. The synthesis therefore reflects patterns present in the existing literature rather than post hoc interpretation or expansion.
This discipline ensures that synthesis functions as an organizational step, not as a site of theory generation.
Fixed Analytical Questions
Each paper is examined using the same set of fixed analytical questions, focusing on:
the spatial pattern analyzed,
the governance mechanism discussed (if any),
the type of empirical evidence employed, and
the limitations explicitly acknowledged by the authors.
Applying identical questions across all studies ensures direct comparability and guards against narrative bias.
Extracted Definitions and Core Concepts
Across the literature, several definitions recur with high consistency:
Corridor-oriented megaregions are described as spatial systems characterized by linear continuity, infrastructure-mediated connectivity, and functional integration across jurisdictions.
Core–periphery megaregions are defined by dominant central nodes, steep spatial gradients, and hierarchical spatial organization.
Polycentric systems are framed as multi-core configurations that may nonetheless exhibit internal asymmetries or incomplete integration.
These definitions are recorded as descriptive constructs, not as evaluative or normative categories.
Recurring Mechanisms Identified in the Literature
The structured synthesis highlights several mechanisms repeatedly discussed across studies:
infrastructure investment as a driver of cross-jurisdictional integration,
administrative boundaries as sources of spatial discontinuity or segmentation,
functional connectivity (e.g., mobility, commuting, economic interaction) that may diverge from formal administrative structure, and
governance arrangements influencing the degree to which spatial continuity is reinforced or constrained.
Importantly, the literature does not treat these mechanisms as deterministic. Many studies emphasize context dependence, hybrid outcomes, and uneven implementation.
Policy-Relevant Findings (Non-Normative)
When aggregated, the literature indicates that:
spatial form is more consistently associated with governance configuration than with absolute density levels,
formal policy intent does not guarantee corresponding spatial outcomes, and
infrastructure-led integration often precedes or substitutes for formal megaregional governance arrangements.
These findings are reported as patterns of alignment, not as causal explanations or policy prescriptions.
Methodological Transparency Statement
This synthesis follows a transparent, rule-governed procedure in which:
the evidence base is predefined and closed,
analytical questions are fixed in advance, and
interpretive authority remains with the analyst rather than with the synthesis procedure itself.
By maintaining these constraints, the synthesis provides a clear and defensible bridge between mapped academic evidence and the strategic implications discussed in subsequent sections, without exceeding the analytical scope established earlier.
8. Strategic Implications for G2 Competition
This section translates the synthesized spatial and governance patterns into structural strategic implications relevant to long-term competition between major powers. The analysis operates at the level of megaregional configuration, not at the level of policy evaluation, institutional performance, or outcome prediction. No claims are made regarding superiority or effectiveness.
8.1 Megaregional Form as Strategic Architecture
The contrast between BosWash and Jing-Jin-Ji highlights two distinct megaregional architectures:
Corridor-oriented continuity, in which multiple urban cores are linked through spatial and functional integration across jurisdictions.
Core–periphery concentration, in which political and administrative centers dominate population distribution and peripheral areas remain structurally differentiated.
These architectures shape how population, infrastructure, and institutions are spatially organized, thereby conditioning the strategic environment in which economic activity, governance coordination, and crisis response occur.
8.2 Governance Capacity and Scalability
Corridor-oriented systems embed governance capacity within networks rather than hierarchies. Coordination emerges through infrastructure, markets, and inter-jurisdictional interaction, enabling flexibility but limiting centralized control. Scalability in such systems depends on the ability to align multiple actors across space without a single commanding authority.
Core–periphery systems concentrate governance capacity within dominant centers. This configuration enables direct administrative reach and rapid mobilization within core areas, but may face scaling constraints as coordination costs increase across peripheral zones and administrative boundaries.
8.3 Infrastructure, Lock-in, and Path Dependence
Spatial form influences how infrastructure investments scale and lock in future trajectories. Corridor-based continuity favors incremental expansion along existing axes, reinforcing network effects and spatial connectivity. Core-centered concentration favors radial or hierarchical infrastructure patterns that reinforce central dominance.
Once established, these infrastructure logics generate path dependence, constraining future strategic options regardless of short-term policy adjustments.
8.4 Risk Exposure and Stress Distribution
Different megaregional structures distribute systemic risks differently:
Corridor-oriented systems may diffuse congestion and economic shocks across space, but can be vulnerable to cascading disruptions along critical corridors.
Core–periphery systems may intensify congestion, inequality, and environmental stress in core areas while leaving peripheral zones underutilized or weakly integrated.
These risks are structural properties of spatial configuration rather than outcomes of specific policy choices.
8.5 Competitive Advantages and Constraints
From a G2 perspective, megaregional structure shapes competitive advantages indirectly:
Innovation capacity, logistics efficiency, and resilience are influenced by how density and connectivity are organized.
No single megaregional form guarantees strategic dominance; each embeds trade-offs between control and flexibility, concentration and continuity.
The strategic implication is not that one model should replace another, but that spatial structure itself functions as a strategic variable—one that conditions how governance capacity, infrastructure, and population interact over time.
By treating megaregions as structural platforms rather than policy outcomes, this section establishes a non-normative basis for understanding how spatial configuration influences long-term competition between major powers.
9. Implications for Legislative Policymakers
The comparative analysis of BosWash and Jing-Jin-Ji offers insights that are directly relevant to legislative policymakers, particularly those engaged in metropolitan governance, infrastructure planning, and evidence-based policy making. This section does not propose policy prescriptions. Instead, it highlights how spatial structure conditions policy choice, implementation capacity, and long-term outcomes.
9.1 Spatial Structure as a Policy Variable
Population density patterns reveal that spatial structure is not a neutral backdrop to policy, but an active variable that shapes how policies function in practice. Corridor-oriented continuity and core–periphery concentration create different environments for coordination, service delivery, and infrastructure investment. Legislators evaluating regional policy must therefore consider how spatial form constrains or enables governance, rather than assuming that policy instruments operate uniformly across space.
9.2 Metropolitan Governance and Legislative Oversight
In corridor-oriented systems, governance is typically fragmented across jurisdictions, with coordination emerging through infrastructure projects, regulatory alignment, and informal coalitions. Legislative oversight in such contexts must focus on cross-jurisdictional coherence, interoperability, and long-term alignment of investment decisions.
In core–periphery systems, governance capacity is concentrated within central authorities, enabling direct intervention but also heightening the risk of spatial imbalance. Legislative scrutiny in these contexts must consider how central decisions translate into peripheral outcomes, and whether administrative boundaries reinforce unintended spatial segmentation.
9.3 Implications for Evidence-Based Policy Making (EBPM)
The analysis underscores the value of geospatial evidence in EBPM. Population density maps provide a clear, interpretable baseline that can reveal structural patterns invisible in aggregate statistics. For legislators, such visual evidence can:
clarify where policy effects are likely to concentrate,
identify boundary-induced discontinuities,
and inform more realistic expectations about policy scalability.
Incorporating spatial analysis into legislative review processes can improve policy design by aligning interventions with existing spatial structure.
9.4 Questions for Legislative Evaluation
Rather than prescribing specific policies, the comparison suggests a set of guiding questions for legislative consideration:
Does the proposed policy assume spatial continuity where segmentation exists?
Are administrative boundaries aligned with functional population patterns?
How will infrastructure investments reinforce or alter existing density structures?
Where are coordination costs likely to emerge across jurisdictions?
What spatial risks—congestion, inequality, environmental stress—are structurally embedded in the current configuration?
9.5 Legislative Relevance Beyond Case Regions
Although grounded in BosWash and Jing-Jin-Ji, these implications extend beyond the two cases. Legislators operating in other national or regional contexts can use this framework to interrogate their own megaregional structures, ensuring that policy debates account for spatial realities rather than abstract administrative models.
By treating spatial structure as an explicit object of legislative attention, policymakers can strengthen the analytical foundation of regional governance and improve the alignment between policy intent and spatial outcome.
10. Limitations
This study is subject to several limitations that define the scope of its findings and constrain the interpretations that can be drawn.
First, the geospatial analysis is intentionally introductory in level. It relies on basic spatial operations—boundary integration, area calculation, population density computation, and choropleth visualization. No advanced spatial statistics, spatial econometric models, or causal inference techniques are applied. As a result, the analysis is descriptive rather than explanatory.
Second, the academic literature incorporated in the synthesis represents a limited and curated sample. Although selected through a structured and transparent intake process, the literature does not constitute a comprehensive review of all work on megaregions, urban systems, or regional governance. Findings from the synthesis should therefore be understood as indicative of recurring themes rather than exhaustive representations of the field.
Third, population density is used as a single analytical dimension. While density is a policy-relevant and interpretable indicator, it does not capture other critical aspects of megaregional dynamics, such as economic productivity, mobility flows, environmental impact, social inequality, or institutional performance. Spatial patterns identified in this study may differ when examined through alternative indicators.
Fourth, the analysis relies on administrative spatial units (county-level units in the United States and ADM2-level units in China). As with all analyses based on predefined spatial aggregations, the results are subject to the Modifiable Areal Unit Problem (MAUP), whereby observed spatial patterns may vary depending on the scale or configuration of the units used. This constraint is inherent to administrative-unit analysis and does not negate the structural comparisons made here, but it should be borne in mind when interpreting density gradients and boundary effects.
Finally, the study does not evaluate policy effectiveness, governance quality, or developmental outcomes. The comparisons are structural and non-normative, focusing on spatial configuration rather than success or failure. These limitations are intentional and reflect the study’s emphasis on transparency, comparability, and analytical discipline.
Recognizing these constraints is essential for situating the results appropriately and for guiding future extensions of the analysis.
11. Conclusion
This study has examined BosWash and Jing-Jin-Ji as megaregional spatial systems, using population density as a transparent and policy-relevant entry point for comparison. By relying exclusively on open data and introductory geospatial methods, the analysis demonstrates how large-scale spatial structures can be visualized, compared, and interpreted without recourse to proprietary tools or complex modeling.
The results show that megaregions function as spatial operating systems of great powers. Population density patterns are not merely demographic outcomes; they are expressions of underlying governance logic. BosWash exhibits a corridor-oriented, polycentric structure characterized by spatial continuity across jurisdictions, while Jing-Jin-Ji displays a centralized core–periphery configuration marked by sharp internal discontinuities.
These contrasting forms highlight that spatial structure conditions governance capacity, infrastructure scalability, and risk distribution. Governance strength and spatial integration do not scale linearly, and neither megaregional form can be reduced to a universally optimal model. Instead, each represents a distinct configuration through which population, infrastructure, and authority are organized.
The study also illustrates the value of integrating geospatial evidence with structured literature synthesis. By sequencing maps before theory and employing a controlled, AI-assisted review of academic research, the analysis maintains analytical discipline while situating observed patterns within a broader conceptual context.
Finally, the findings underscore why geospatial analysis matters for understanding future G2 competition. As economic and political power increasingly concentrates in megaregions, the spatial architectures of these systems will shape innovation potential, resilience, and strategic flexibility. Future work will extend this framework to additional indicators—including transport networks, emissions, night-time lights, and spatial statistics—to further illuminate how megaregional form influences long-term national trajectories.
12. References
Balakrishnan, S. (2013).Highway urbanization and land conflicts: The challenges to decentralization in India.Pacific Affairs, 86, 785–811.https://doi.org/10.5509/2013864785
Cardoso, R., & Meijers, E. (2020).Metropolisation: The winding road toward the citification of the region.Urban Geography, 42, 1–20.https://doi.org/10.1080/02723638.2020.1828558
Erfurth, K., Gross, M., Rendtel, U., & Schmid, T. (2021).Kernel density smoothing of composite spatial data.AStA Advances in Statistical Analysis.https://doi.org/10.1007/s11943-021-00298-9
Feng, Y., Wu, S., Wu, P., Su, S., Weng, M., & Bian, M. (2018).Spatiotemporal characterization of megaregional poly-centrality.Land Use Policy.https://doi.org/10.1016/j.landusepol.2018.06.022
Friedmann, J., & Sørensen, A. (2019).City unbound: Emerging mega-conurbations in Asia.International Planning Studies, 24, 1–12.https://doi.org/10.1080/13563475.2019.1555314
He, D., Sun, Z., & Gao, P. (2019).Development of economic integration in the Central Yangtze River Megaregion.Sustainability.https://doi.org/10.3390/su11195401
Holt, J., Lo, C., & Hodler, T. (2004).Dasymetric estimation of population density.Cartography and Geographic Information Science.https://doi.org/10.1559/1523040041649407
Huang, X., Li, G., & Liu, J. (2020).The impact of spatial structure on economic efficiency of Beijing–Tianjin–Hebei.Complexity.https://doi.org/10.1155/2020/6038270
Jones, B., Balk, D., & Leyk, S. (2020).Urban change in the United States, 1990–2010.Sustainability.https://doi.org/10.3390/su12041649
Li, W., Zhou, W., Han, L., & Qian, Y. (2019).Uneven urban-region sprawl of China’s megaregions.Ecological Indicators.https://doi.org/10.1016/j.ecolind.2018.10.004
Öberg, M., Nilsson, K., & Johansson, C. (2018).Complementary governance for sustainable development in transport.Case Studies on Transport Policy.https://doi.org/10.1016/j.cstp.2018.08.006
Reia, S., Rao, P., Barthelemy, M., & Ukkusuri, S. (2022).Spatial structure of city population growth.Nature Communications.https://doi.org/10.1038/s41467-022-33527-y
Su, S., Liu, Z., Xu, Y., Li, J., Pi, J., & Weng, M. (2017).China’s megaregion policy: Performance evaluation framework, empirical findings and implications for spatial polycentric governance.Land Use Policy, 63, 1–19.https://doi.org/10.1016/j.landusepol.2017.01.014
Wang, G., Peng, W., & Zhang, L. (2023).Estimate of population density and diagnosis of spatial heterogeneity.Heliyon.https://doi.org/10.1016/j.heliyon.2023.e16285
Wang, Y., Zhuo, Y., & Liu, T. (2022).Population dynamics in China’s urbanizing megaregion.Land.https://doi.org/10.3390/land11091394
Wiig, A., & Silver, J. (2019).Turbulent presents, precarious futures: Urbanization and the deployment of global infrastructure.Regional Studies, 53, 912–923.https://doi.org/10.1080/00343404.2019.1566703
Yu, W., & Zhou, W. (2017).Spatiotemporal pattern of urban expansion in China.Remote Sensing.https://doi.org/10.3390/rs9010045
Zhang, W., Fang, C., Zhou, L., & Zhu, J. (2020).Measuring megaregional structure in the Pearl River Delta by mobile phone signaling data.Cities, 104, 102809.https://doi.org/10.1016/j.cities.2020.102809
13. Appendix
This appendix documents the technical, procedural, and definitional elements that support the main analysis. All materials are provided to ensure transparency, reproducibility, and auditability, consistent with the structure-fixed methodology used throughout the study.
13.1 Python Code and Analytical Workflow
The complete Python workflow used in this study covers the following components:
Data loading and preprocessing
Import of administrative boundary files
Import and cleaning of census-based population tables
Spatial data preparation
Geometry validation
Coordinate reference system (CRS) handling
Land area calculation (km²)
Indicator construction
Population density computation (people per km²)
Visualization
Standardized choropleth mapping
Fixed classification logic, color encoding, and legends
Interactive map outputs suitable for web publication
All code is written to be executable in a cloud-based notebook environment and relies solely on open-source Python libraries.
13.2 Thesis Network Construction
To support Section 7, a conceptual thesis network is constructed using the following steps:
Each selected academic paper is treated as a node.
Conceptual relationships are defined based on shared attributes identified during structured extraction, including spatial form, scale, governance presence, and empirical method.
Edges represent conceptual proximity rather than citation counts or bibliometric metrics.
This network is used for organizational clarity, not for quantitative ranking or impact assessment.
13.3 Sample Consensus Queries
The literature discovery stage employs standardized query templates designed to surface recurring thesis families rather than exhaustive bibliographies. Example query themes include:
Megaregions and mega-urban regions
Corridor urbanization and infrastructure-led integration
Core–periphery and polycentric spatial structures
Administrative boundary effects and spatial discontinuities
Functional integration through mobility or commuting networks
Queries are iteratively refined to emphasize spatial form and empirical grounding.
13.4 Structured Extraction Templates
Literature synthesis is conducted using fixed extraction templates applied uniformly across all selected papers. Each template is designed to record the following elements in a standardized manner:
the spatial pattern analyzed,
any governance mechanism explicitly discussed,
the type of empirical evidence employed, and
the limitations explicitly acknowledged by the authors.
No adaptive, paper-specific, or ad hoc extraction criteria are used. Applying the same templates across the entire corpus ensures consistency, comparability, and protection against interpretive drift during synthesis.
13.5 Glossary of Key Terms
MegaregionA large, multi-city urbanized system characterized by dense functional, infrastructural, and demographic integration across jurisdictions.
Corridor-oriented structureA spatial configuration in which population and activity are distributed along linear axes connecting multiple urban cores.
Core–periphery structureA spatial configuration dominated by one or a small number of central cores, with sharp density gradients separating core and peripheral areas.
Population densityThe number of people per square kilometer of land area, used in this study as a normalized indicator for spatial comparison.
Structure-fixed methodologyAn analytical approach in which the sequence of steps, indicators, and interpretive boundaries are locked in advance and not altered during analysis.
Evidence freezeA procedural rule under which no new data, literature, or indicators are introduced after a specified analytical stage.
13.6 Scope Reminder
Materials included in this appendix are intended to support replication and verification, not to extend or reinterpret the analysis. All substantive findings and interpretations are contained within the main body of the manuscript.
This appendix completes the documentation of the analytical framework used in this study.
Download the full research paper (PDF)


Comments